In MiTS 3, the Storm Water module is designed to simulate and analyse real-life drain design scenarios, featuring a time series graph for comprehensive data assessment. This graph proves invaluable for users by allowing them to examine specific parameters over time, with the capability to adjust the data range according to their needs. To generate this graph, users must analyse the project using Analysis mode.
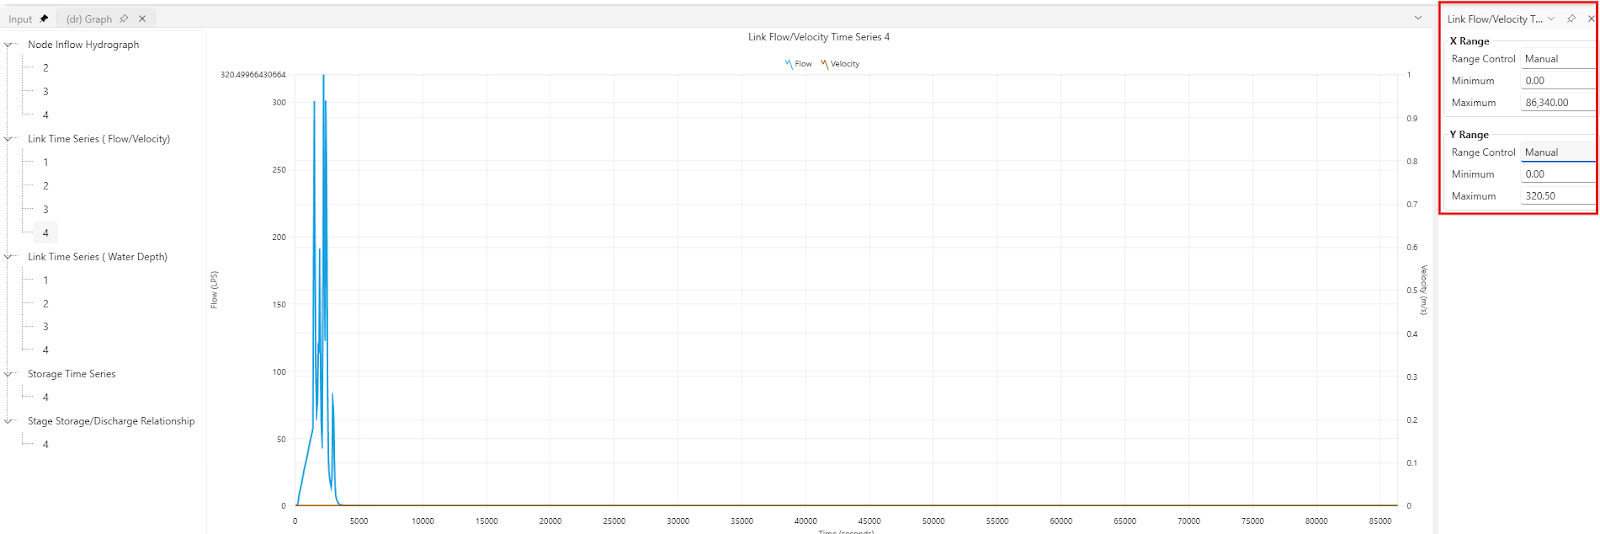
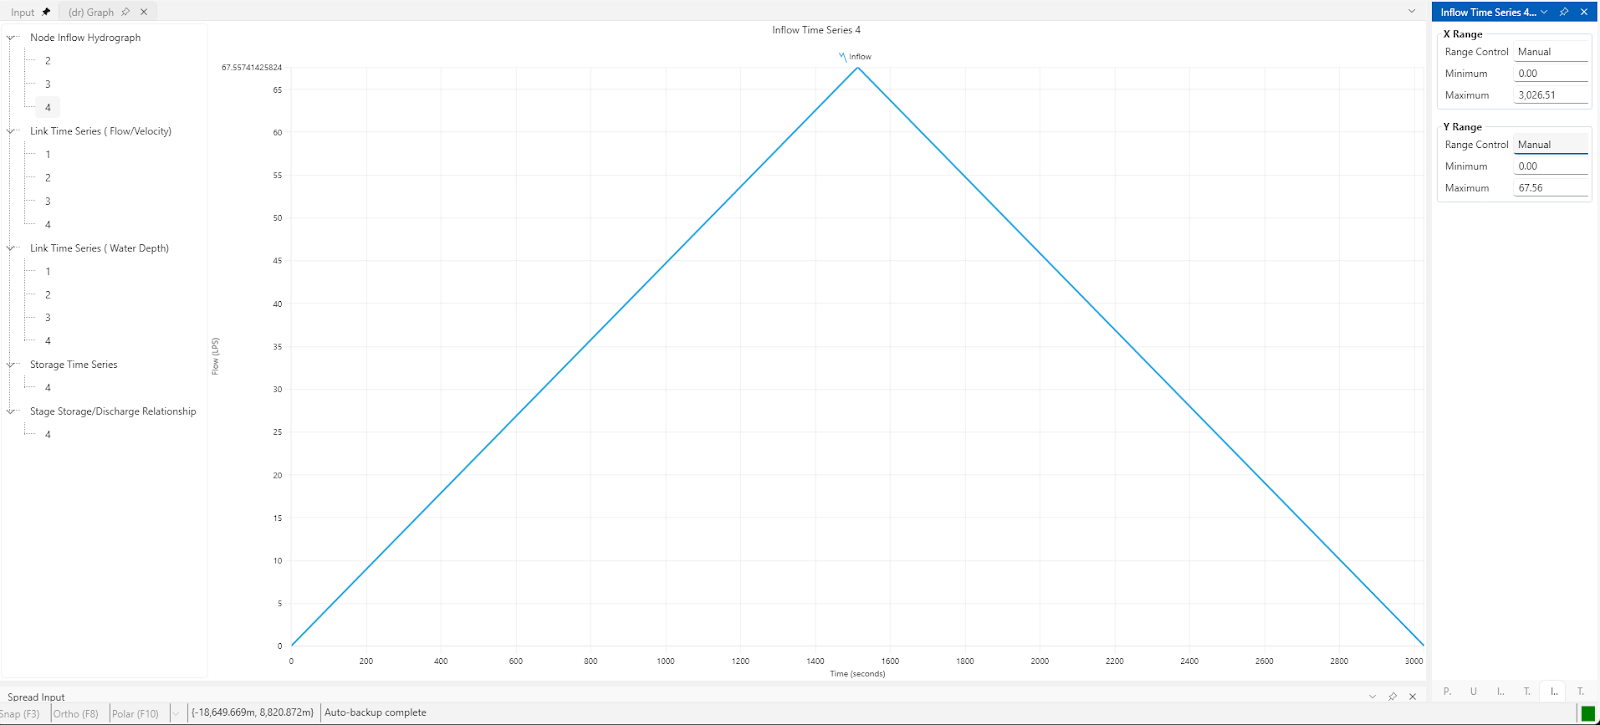
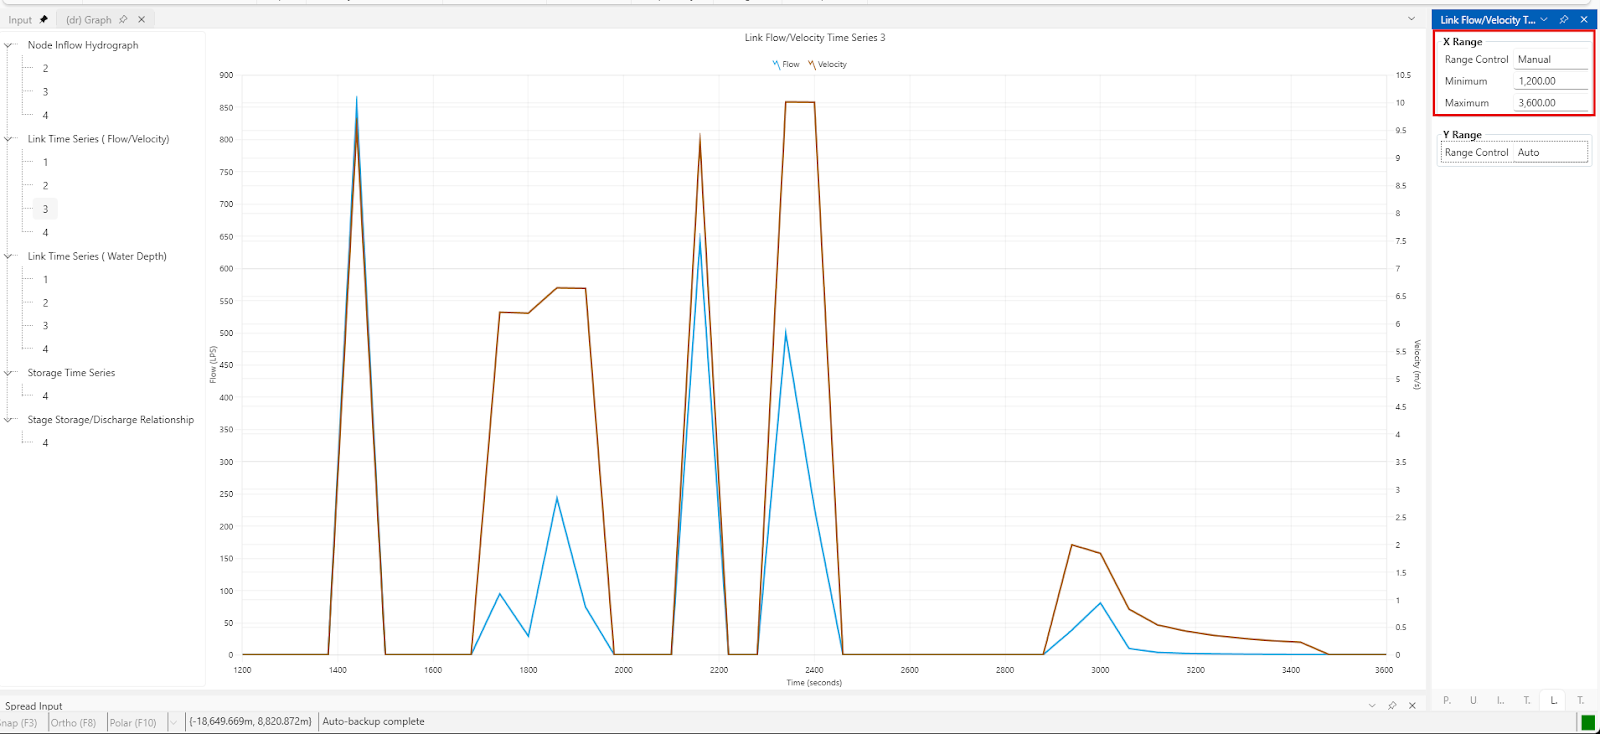
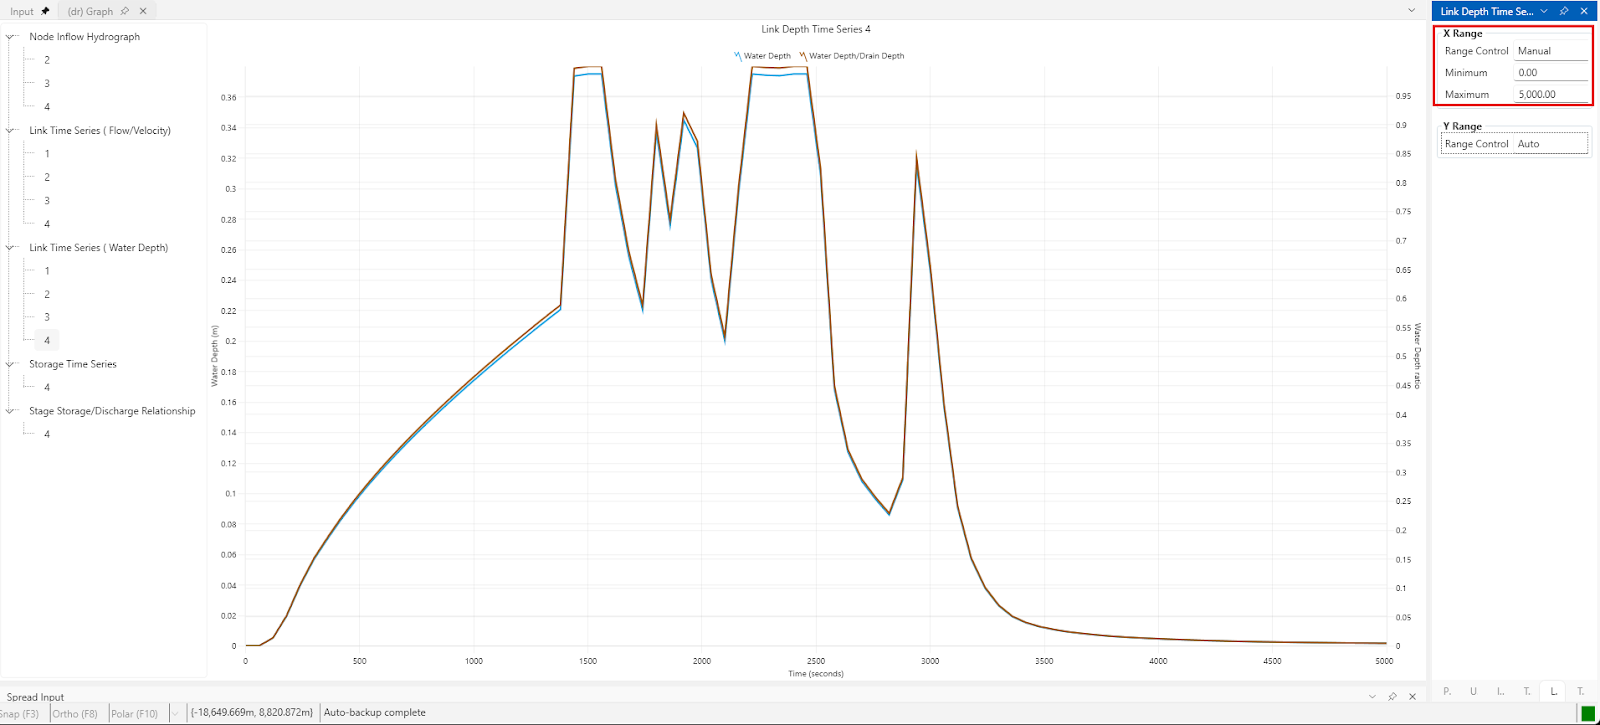
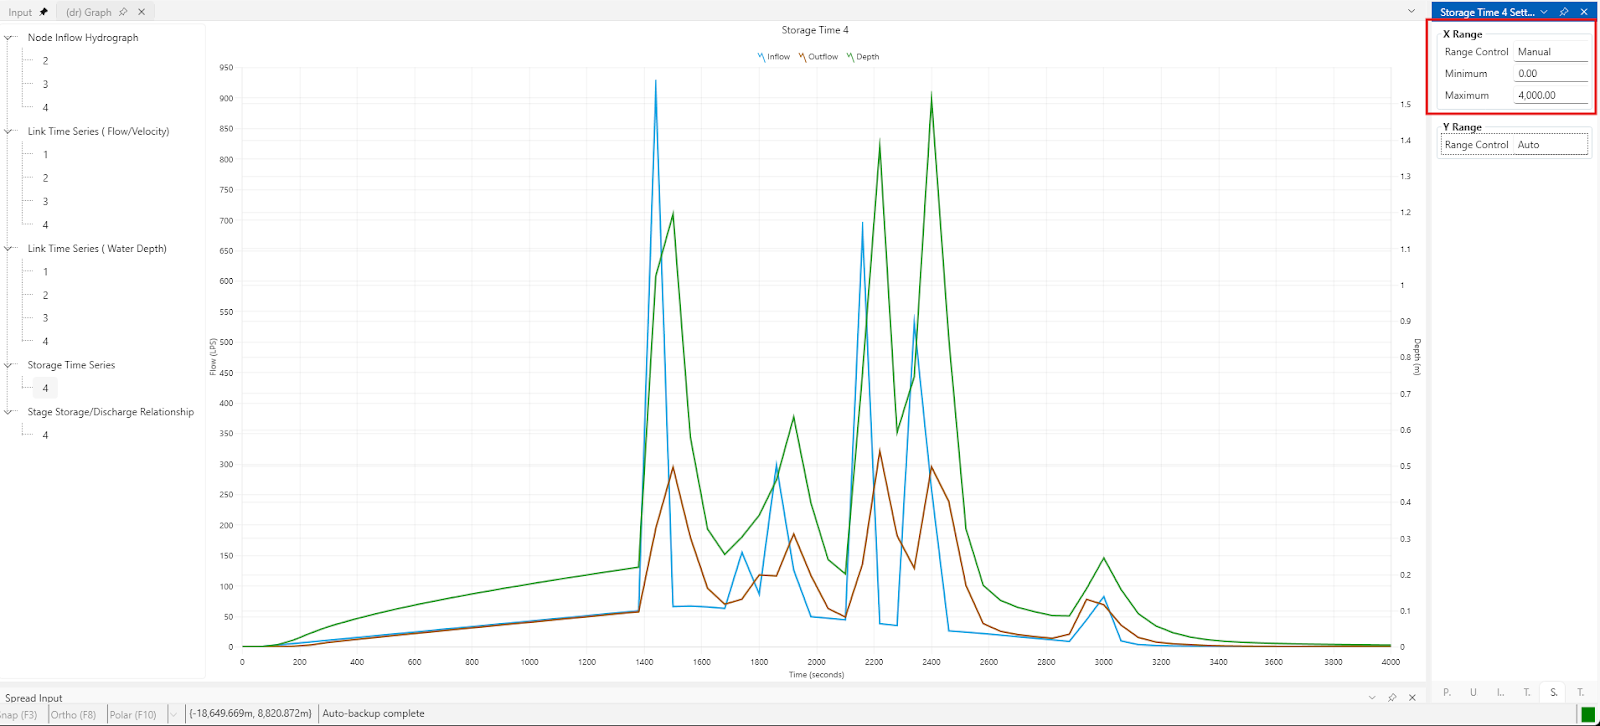
By default, the graph displays a 24-hour period of parameters vs time such as flow, velocity and water depth, but users can refine this by setting custom minimum and maximum values.
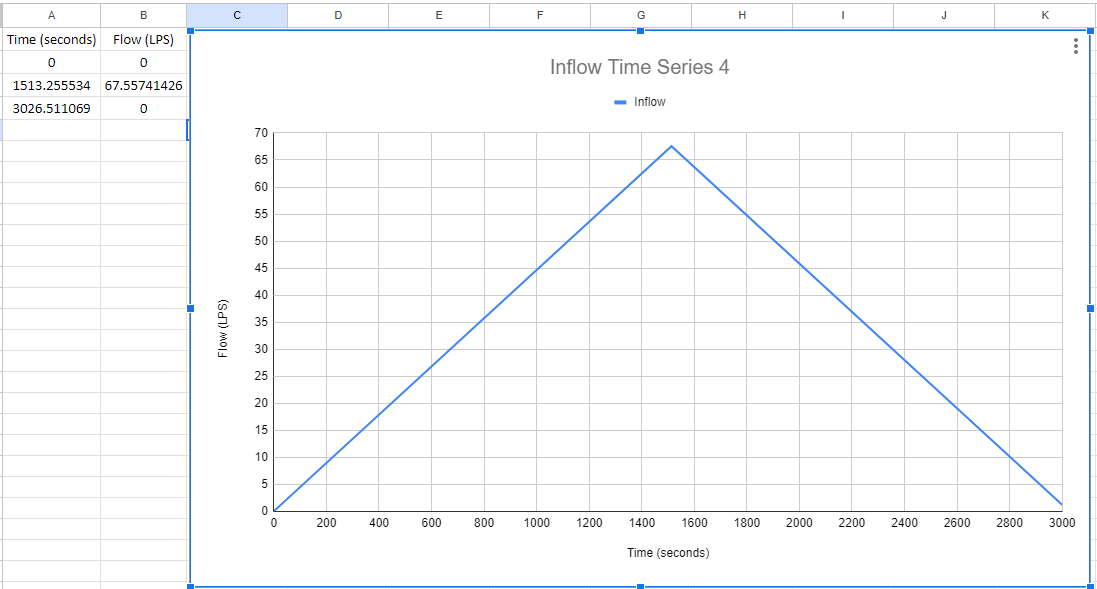
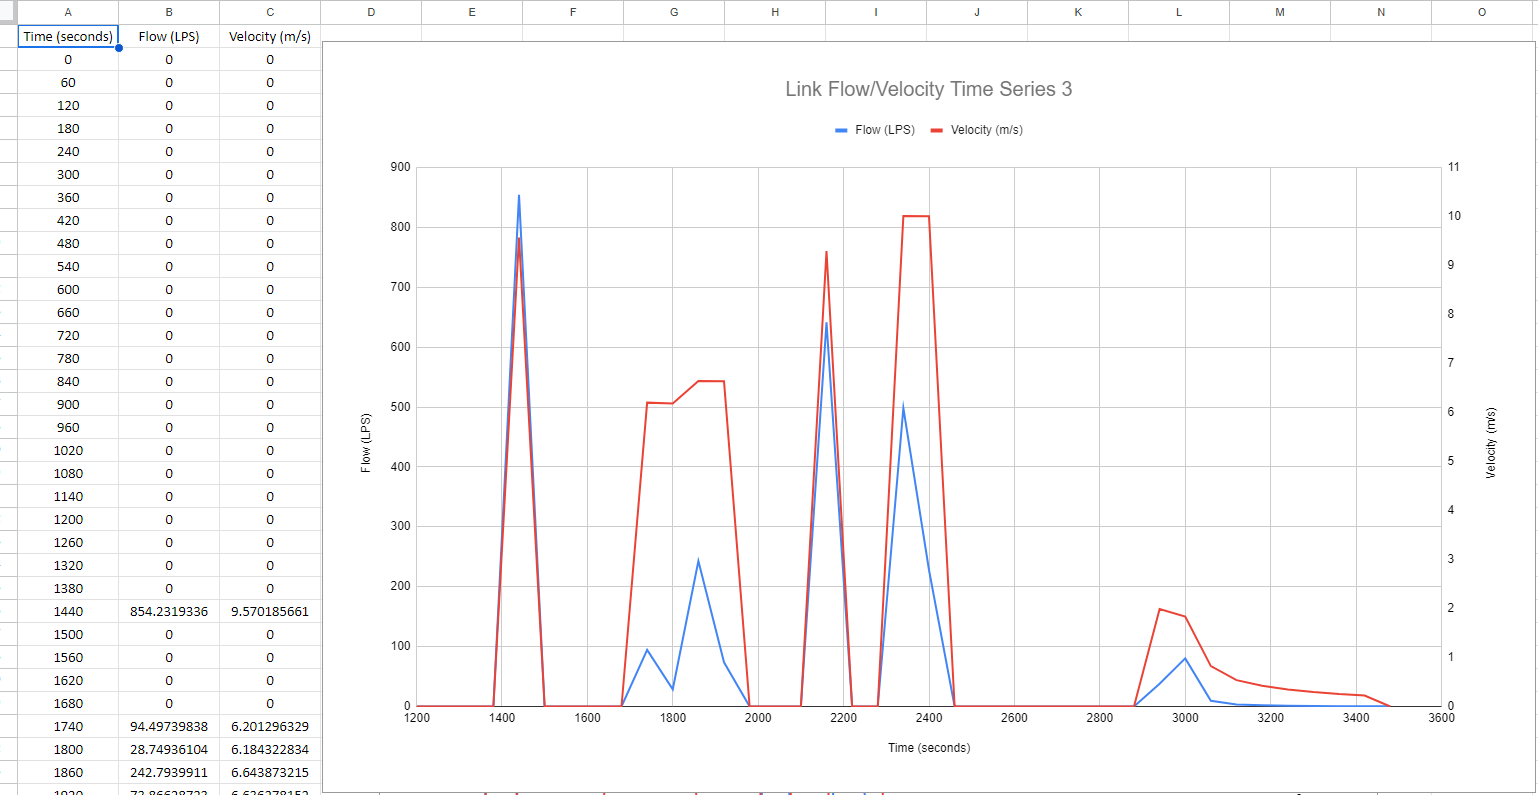
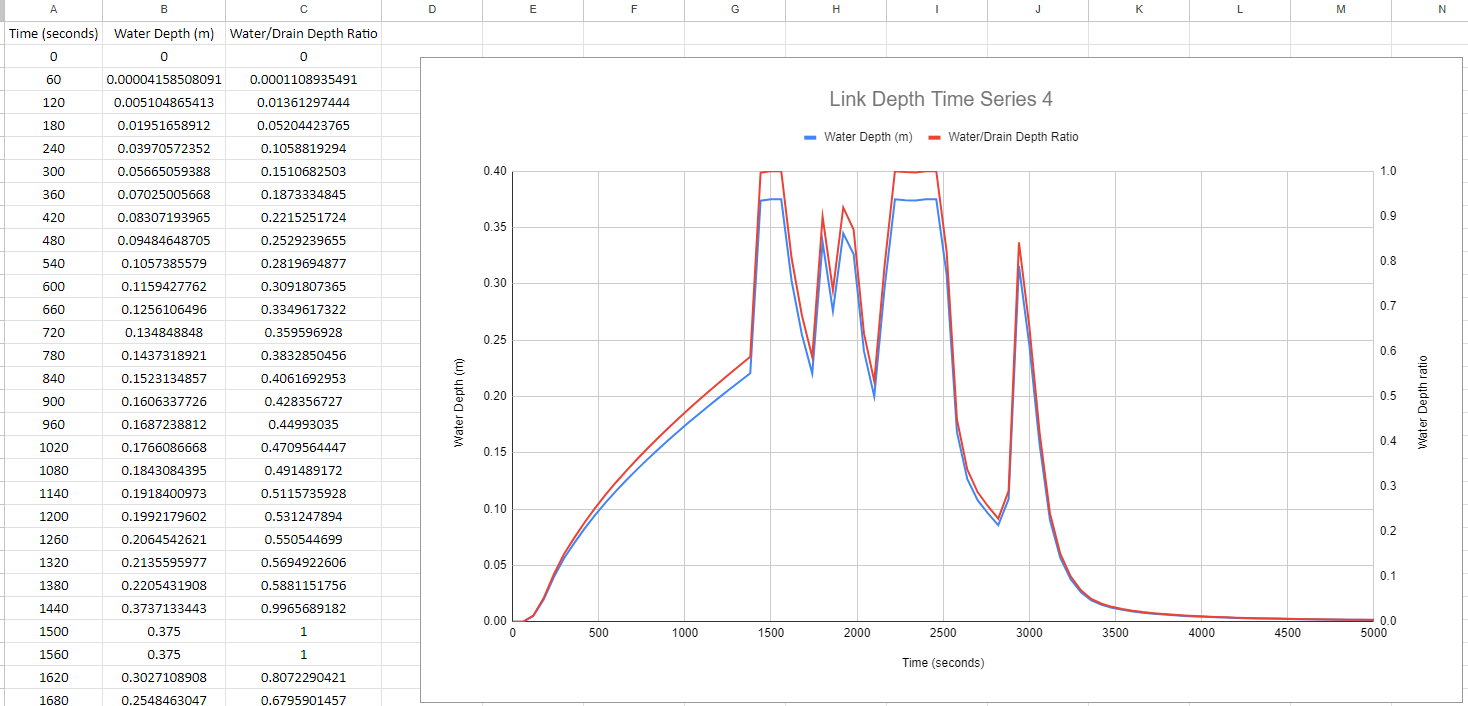
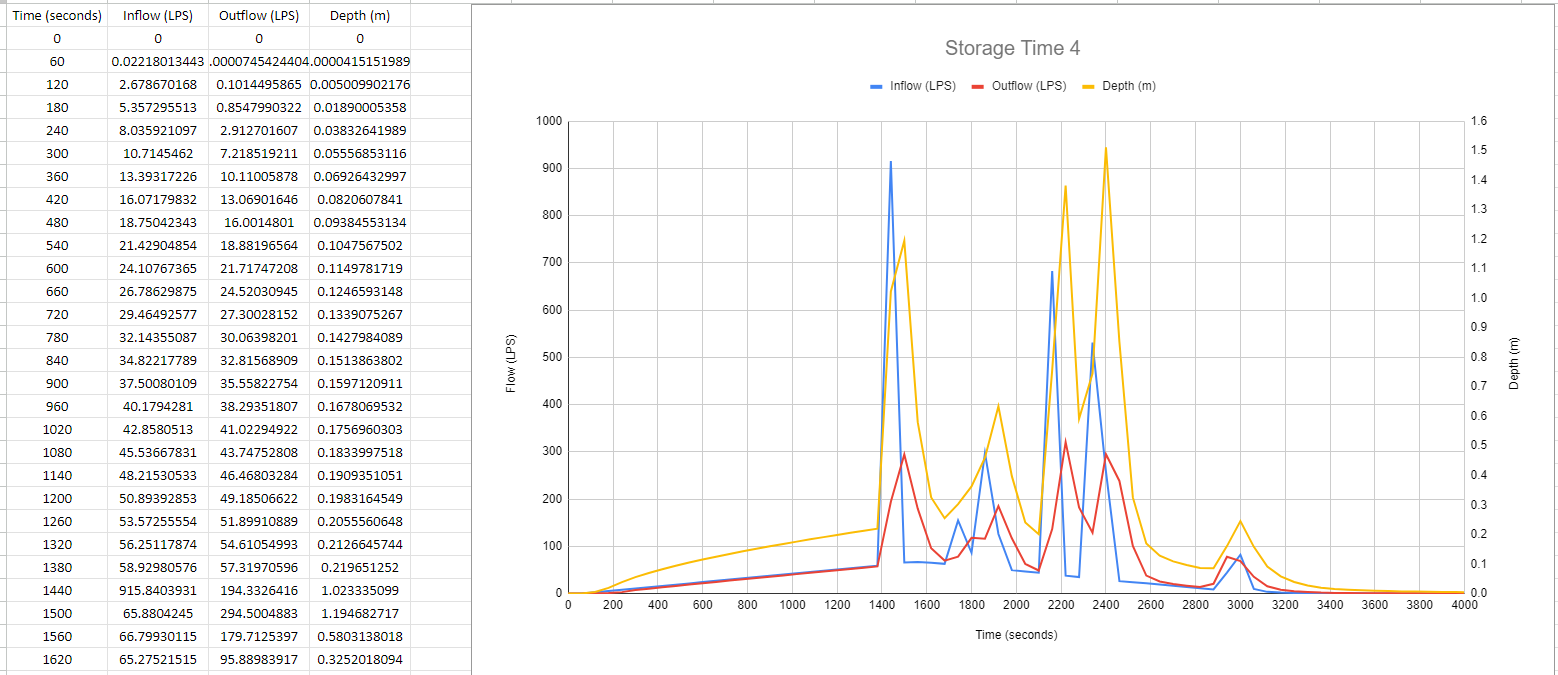
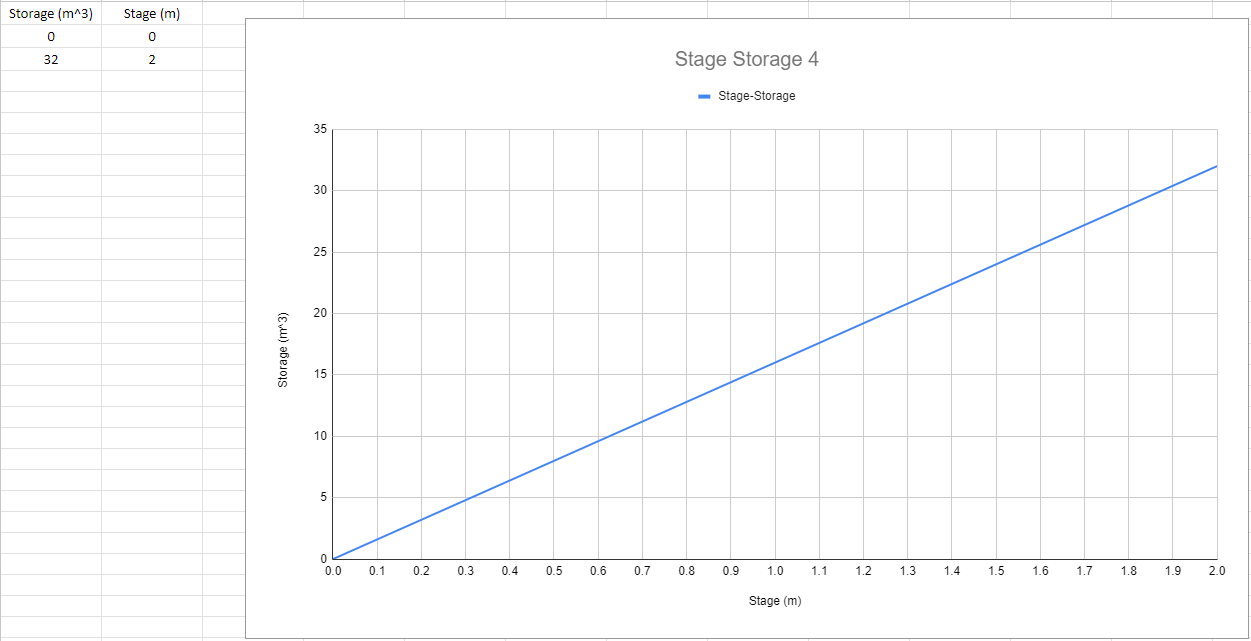
Additionally, exporting the graph to Excel transforms the data into a table format, making it pinpointing and analysing specific data points easier. Users can also recreate the graph in Excel for further visualisation.
Example Project File HERE
Spreadsheet HERE
Node Inflow Hydrograph
Link 3 Time Series (Flow/Velocity)
Link 4 Time Series (Water Depth)
Storage Time Series
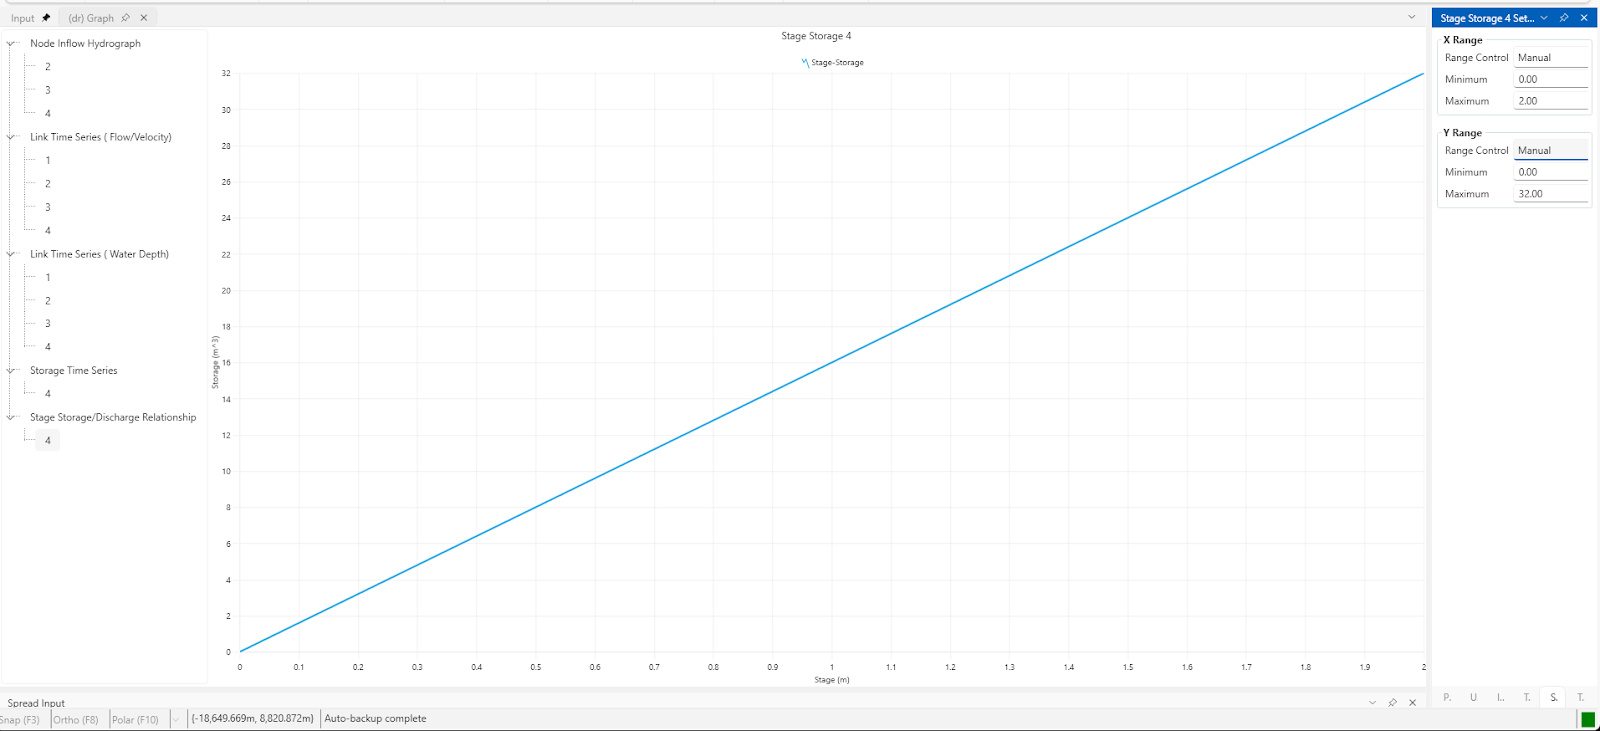
Stage Storage/Discharge Relationship

I’m the Benevolent Dictator for Life for MiTS Software cum Editor of this website. Read more here.
You can also contact me at soonhui@mes100.com


